
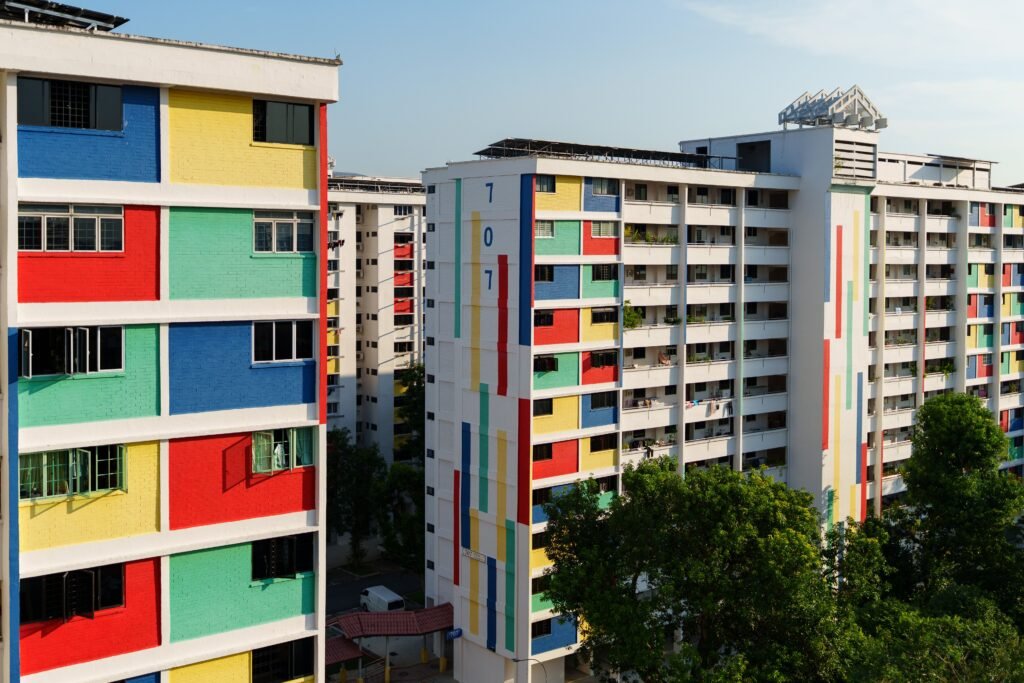
In short: In Q2 2026 the HDB Resale Price Index fell 0.3% — its second straight quarterly drop, the first back-to-back decline in about seven years. In the same quarter, a record 491 flats sold for at least S$1 million. Both are true because they measure different things. The index tracks what a typical flat costs, and the typical flat softened. The million-dollar records come from a small, scarcity-driven premium tail that has detached from the rest of the market. If you’re buying or selling, the number that matters is what flats like yours are actually transacting at — not the national index.
Figures are as of Q2 2026 (HDB Q2 2026 resale statistics). This article supports our main analysis, Inside Singapore’s Two-Speed Property Market.
Update, 13 September 2026: Two fresh five-room records landed within 24 hours on 9 Sep 2026, reinforcing the two-speed thesis. A 1,151 sq ft unit at 1B Cantonment Road in The Pinnacle@Duxton cleared for S$1.701 million / S$1,477 psf (28th–30th floor, ~84 years remaining lease) — a new Central Area HDB resale record. The same day, 445A Clementi Avenue 3 cleared for S$1.59 million / S$1,307 psf (1,216 sq ft, 37th–39th floor, ~94 years remaining lease), surpassing the prior S$1.63M block record set in May 2026 on the higher 43rd–45th floors — i.e., today’s print is a stronger per-floor result. ERA’s Sep 9 update also reports that under-55 private property owners bought 7 five-room or larger resale HDB flats in the month following the 28 Jul 2026 lift of the 15-month wait-out period, up from 2 in the month before — the first empirical signal that the wait-out removal is rerouting upgrader demand into premier-tier resale rather than thinning it. Net effect: the premium tail continues to detach from the broad HDB index, and the Q3 2026 Resale Price Index (due ~23 October 2026) is likely to print flat-to-slightly-down even as the million-dollar transaction count pushes past the Q2 2026 record of 491. For an owner of a non-prime four-room, the index story remains your story; for an upgrader targeting a high-floor premier flat, scarcity is still doing more work than macro sentiment.
Sources: Stacked Homes — Record S$1.701M Resale Five-Room at The Pinnacle @ Duxton (9 Sep 2026); Yahoo News Singapore — New records set for five-room flats at Pinnacle@Duxton and Clementi; ERA Singapore — Are more private home owners eyeing larger resale HDB flats? (9 Sep 2026). Treat the ERA transaction counts as directional agency data, not definitive; verify against HDB caveat data before any client-facing citation.
Update, 30 September 2026: The premium-segment tail extended again inside a three-week window, with two fresh five-room prints that confirm both the floor-bias and the per-town dynamics flagged in the previous update. A 1,151 sq ft unit at 1C Cantonment Road (The Pinnacle@Duxton) cleared for S$1.72 million / S$1,494 psf (19th–21st floor, ~84 years remaining lease, commencing 2011) — a new Central Area HDB resale record for the flat type, and the highest psf ever recorded for any HDB resale flat in the Central Area HDB town. The print beats the 9 Sep 2026 project record at the neighbouring 1B Cantonment Road (S$1.701M / S$1,477 psf, 28th–30th floor) by S$19,000 in quantum AND S$17 psf — a unit roughly nine storeys below the prior record clearing above it. That is the structural signal: scarcity of remaining-lease >84-year stock in the Central Area is letting buyers accept a lower-floor unit at a higher psf, eroding the per-floor penalty the index and resale convention have built in. Same morning, a 1,248 sq ft five-room unit at 8A Upper Boon Keng Road (City View @ Boon Keng family) cleared for S$1.59 million / S$1,273 psf (28th–30th floor, ~89 years remaining lease) — a new Kallang/Whampoa town record, surpassing the prior high of S$1.55M / S$1,231 psf at the same project family from October 2025. Macro context from EdgeProp: 11 HDB resale flats have transacted for S$1.6M or more so far in 2026, against just five in the whole of 2025; three of this year’s 11 are at The Pinnacle@Duxton; and all ten of the highest-priced HDB resale transactions ever recorded in the Central Area HDB town are five-room flats at The Pinnacle@Duxton. The Q3 2026 full Resale Price Index is due ~23 October 2026; the directional read is unchanged from the 13 Sep update — flat-to-slightly-down headline, million-dollar count still climbing — and the buyer-side implication is the same: read transacted caveats for your specific block and floor band, not the national index.
Sources: Yahoo News Singapore / EdgeProp — Five-room flat at Pinnacle@Duxton sets record of $1.72mil; Kallang-Whampoa five-room flat sets town record of $1.59 mil (30 Sep 2026); Stacked Homes — A Pinnacle @ Duxton HDB Just Sold For A Record $1.72M — Beating A Higher-Floor Unit From Just 2 Weeks Earlier (30 Sep 2026). Both prints are caveat-level figures sourced from EdgeProp’s data feed via Yahoo and Stacked Homes; verify against the HDB Resale Statistics portal and URA caveat data before client-facing citation.
The two numbers that seem to contradict each other
- HDB Resale Price Index, Q2 2026: about 202.8, down 0.3% quarter-on-quarter, following a 0.1% dip in Q1. Resale volume was almost flat at 6,268 flats.
- Million-dollar resale transactions, Q2 2026: 491 — a record, up roughly 19.5% on the previous quarter, beating the old high of 480, and making up close to 8% of all resale deals.
Read quickly, that looks impossible: prices down, records up. Read properly, it’s the whole story of the HDB market right now.
The index measures the median, not the market
The Resale Price Index is a hedonic index. It answers one narrow question: what would an identical flat, in an identical location, of an identical age, cost this quarter versus last? It deliberately strips out the mix — which flats sold, where, how new — so it can isolate pure price movement.
That makes it excellent for tracking the trend and close to useless for telling a specific buyer what they’ll actually pay. In Q2 2026, the “what would a typical flat cost” answer fell 0.3%. The “what did the most sought-after flats transact at” answer kept producing records. Both come out of the same data set because the index is being pulled down by softer demand in the broad middle of the market — a standard four-room in a non-prime town — while the top of the pyramid is priced entirely off scarcity.
It’s the same pattern that showed up in the private market the same quarter: the overall private price index rose only because landed homes jumped, while non-landed prices actually slipped. The market isn’t cooling. It’s sorting.
What’s actually driving the million-dollar flats
The record deals are heavily concentrated, led by Toa Payoh and Queenstown, with the Central Area, Bukit Timah, Clementi, Bishan and Kallang/Whampoa making up much of the rest. The common thread is a specific profile: newer, high-floor, large, within a kilometre of a good school, near an MRT station, in a mature estate.
Supply of that exact profile is structurally tight, and getting tighter. New “Prime” and “Plus” flats — the categories HDB now uses for the best-located BTO projects — come with a 10-year Minimum Occupation Period and resale restrictions, which locks up future supply of premium resale stock for a decade. Meanwhile the bottom and middle of the market are well supplied: a steady BTO pipeline (HDB is set to exceed its 55,000-flat target for 2025–2027), a growing wave of flats reaching the end of their MOP, and Executive Condominiums absorbing upgrader demand.
Abundant supply at the bottom, rationed supply at the top. That’s the textbook setup for an index that falls while the records keep breaking.
The bulk of the market is still affordable
It’s worth keeping the tail in perspective. The national median resale price for a four-room flat in Q2 2026 was around S$565,000, and most resale flats still change hands well under S$750,000. The 491 million-dollar deals are a real and widening phenomenon, but they’re still under 8% of transactions. For a young couple buying a four-room in a non-mature estate, the price they face this year is broadly where it was six months ago.
The upgrader’s squeeze
This is where the “HDB prices are falling” headline is actively misleading for the people most likely to act on it.
If you own the desirable kind of flat — high-floor, mature estate, near an MRT — the softer index does not mean your flat is worth less. Flats like yours are still transacting at or near records. So the “cheaper” HDB market the index describes isn’t the one you’re selling into.
And it isn’t really the one you’re buying into either. Upgraders typically move to the next tier up — a city-fringe (RCR) leasehold condo or the entry end of the Core Central Region — and those sub-segments are still being lifted by the same scarcity driving the million-dollar HDB prints. The mass-market condo segment where bargaining power has genuinely returned is not, in most cases, where the upgrader is shopping.
Net effect: you’re sitting on the side of the market that’s holding firm, and buying into the side that’s still inching up. The national index, in this specific case, points the wrong way.
What to do about it
- Read the transactions, not the index. Pull the last 90 days of transacted prices for your specific block, your floor band, and the three closest comparable flats. That’s the price discovery that matters — the RPI is a market-wide average that your flat almost certainly isn’t.
- Don’t assume the million-dollar premium applies to your flat. It’s concentrated in a specific age/location/floor profile. If your flat doesn’t fit that profile, price to the transacted band for flats that look like yours — not to the headlines.
- If you’re selling a premium-profile flat, don’t discount to the index. A falling national index is not a reason to accept a below-market offer on a flat that’s still in a scarcity segment.
- If you’re an upgrader, run both sides of the move at today’s real prices. The trade worked cleanly when both ends were rising together. With your current flat firm and your next home firmer, model the actual gap — don’t assume the “falling” index has made the move cheaper.
The HDB resale market isn’t in a downturn. It’s in a sorting — the index down, the records still breaking. The buyer or seller who understands both halves of that sentence is the one who prices correctly.
Frequently asked questions
How can HDB resale prices be falling while a record number of flats sell for over S$1 million?
The Resale Price Index measures the price change of a typical, like-for-like flat, and that softened 0.3% in Q2 2026. The million-dollar sales are a separate, scarcity-driven premium tail — 491 transactions, a record, but under 8% of all resales — concentrated in newer, well-located flats in mature towns. Different parts of the same market moving in different directions.
Does a falling HDB index mean flats are cheaper now?
On average, marginally — the index is down about 0.4% across the first half of 2026. But averages hide a lot. Sought-after flats in mature estates near MRT stations and good schools are still transacting at records, while the broad middle of the market has softened. Whether flats are “cheaper” depends entirely on the type and location you’re looking at.
Where are Singapore’s million-dollar HDB flats?
In Q2 2026 they were led by Toa Payoh and Queenstown, plus the Central Area, Bukit Timah, Clementi, Bishan and Kallang/Whampoa. The typical profile is a newer, high-floor, larger flat within a kilometre of a good school and close to an MRT station.
Should I wait for HDB resale prices to fall further before buying?
For a standard flat in a non-mature estate, prices have been broadly stable for months and a large BTO and MOP supply pipeline is keeping a lid on them — there’s little urgency, but also little sign of a sharp drop. For a premium-profile flat, waiting hasn’t helped buyers so far. Base the decision on transacted prices for your target flat type, not the national trend.
Related reading: Inside Singapore’s Two-Speed Property Market — the full analysis · ABSD in Singapore — the full rate guide
Sources: HDB Q2 2026 resale statistics; URA, Release of 2nd Quarter 2026 real estate statistics (24 July 2026). Analysis is Smartnest’s own and is not financial advice.